RackHelm ships ten built-in reports covering account health, revenue, products and support. They are reached from the Reports section of the sidebar, each is individually permissioned, and each can also be pinned to the dashboard as a quick-report widget. This article is for staff who read those reports and for whoever has to explain why two of them disagree.
Before you start #
Note: The Reports section of the sidebar needs
view_reports. Opening an individual report additionally needs that report’s ownview_report_*permission — holdingview_reportsalone is not enough. See Roles & Permissions.
How the report engine works #
Each report is a row describing a name, a URL slug, an icon, a description, a sort order and the piece of application logic that produces it. Opening /admin/reports/{slug} looks the row up, checks the permission derived from its slug — account-review becomes view_report_account_review — and then runs the matching logic.
Two consequences follow:
- Reports cannot be created from the admin area. A row must point at logic that already exists, so adding one is an application change, not a setting.
- Every report has two renderings: a full page, and a compact widget used on the dashboard. When a widget fails it shows an inline error box rather than breaking the whole dashboard; the underlying error goes to the application log.
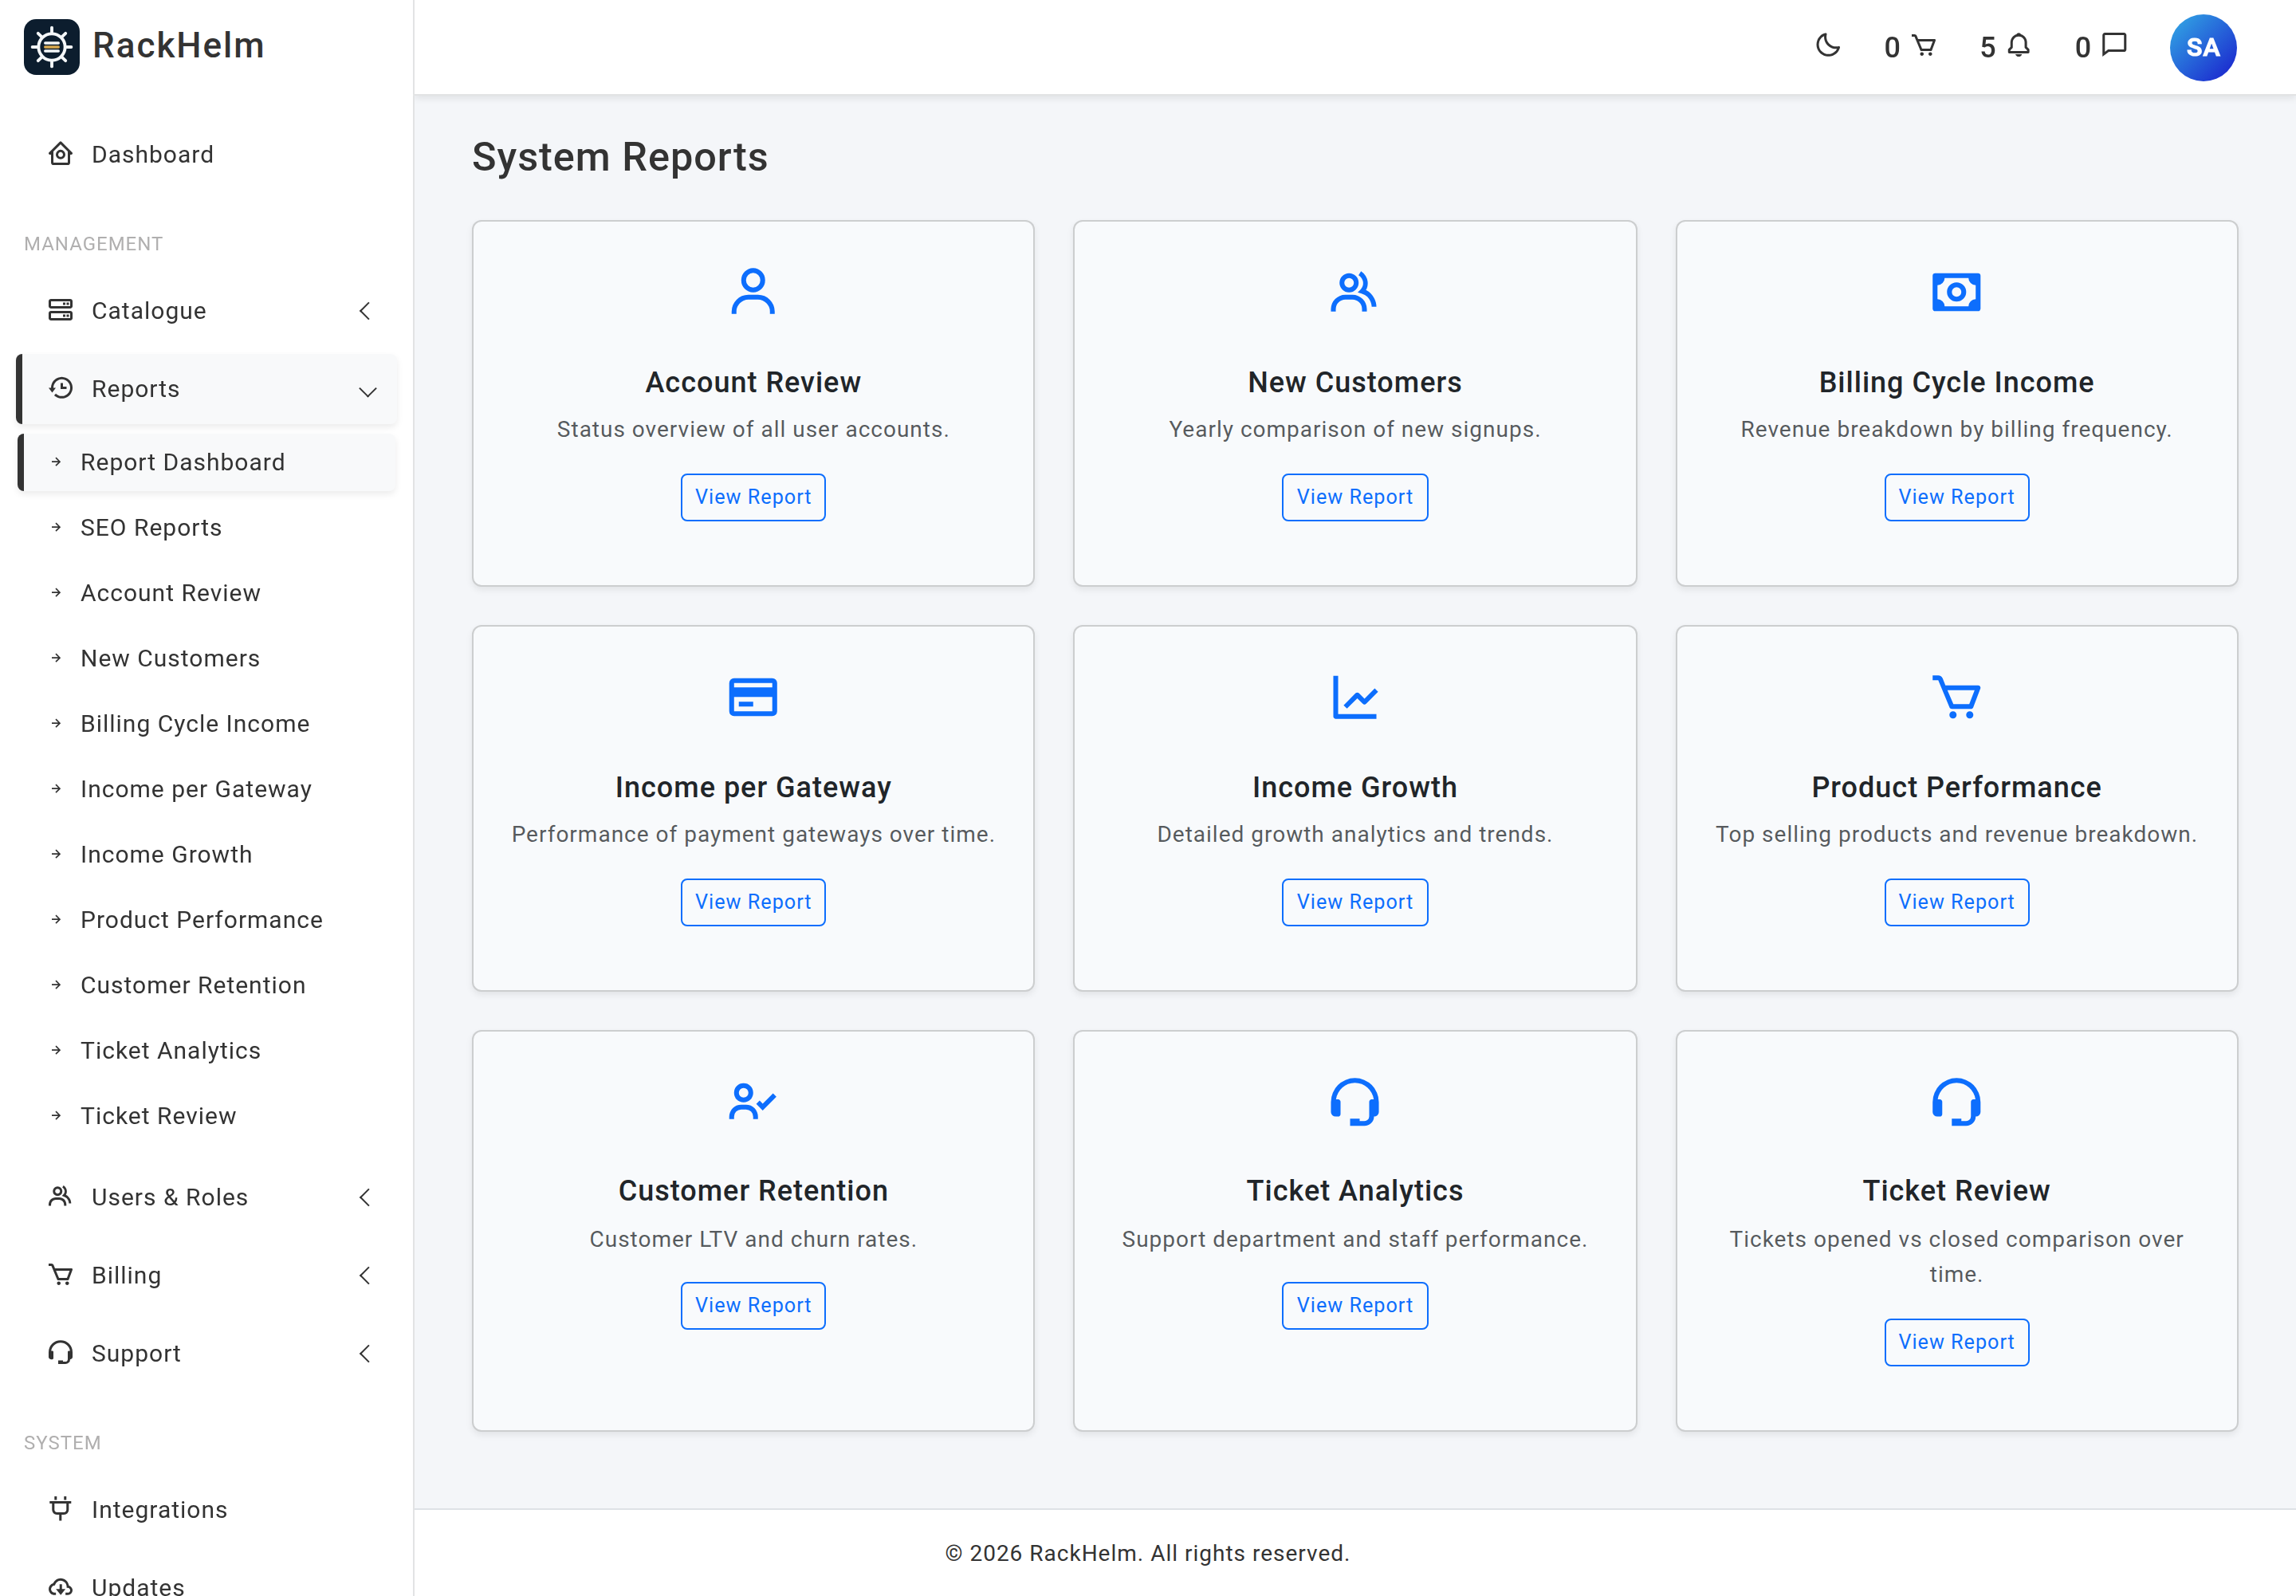
/admin/reports shows a card per active report. If a report has been flagged as the default, that URL redirects straight to it instead.
Note: The report index and the sidebar list every active report, whether or not you hold its permission. A report you cannot see is still offered; clicking it returns “Unauthorized access to this report.” Only the dashboard’s Configure Quick Reports dialog filters by permission.
The ten reports #
| Report | What it shows | Permission |
|---|---|---|
| Account Review | A status overview of every service: Active, Pending Provisioning, Suspended, Cancelled and anything else, counted from order items. | view_report_account_review |
| New Customers | Monthly signups for a chosen year against the previous year. Guest placeholder records are excluded. | view_report_new_customers |
| Billing Cycle Income | Revenue by billing frequency across active items, with the monthly equivalent projected to an expected yearly figure. | view_report_billing_cycle_income |
| Income per Gateway | Paid invoice value by month, split by payment route. | view_report_income_per_gateway |
| Income Growth | Monthly paid revenue with invoice count, average invoice value, month-on-month and year-on-year differences, and a tax figure. | view_report_income_growth |
| Income by Currency | Paid income per currency for a chosen period, with base-currency equivalents, a share-of-income chart and a month-by-month table. | view_report_income_by_currency |
| Product Performance | Top ten products by revenue across active items, and top ten by units sold excluding cancelled and terminated items. | view_report_product_performance |
| Customer Retention | Average lifetime value per customer across paid invoices, the churn rate, and the service status breakdown. | view_report_customer_retention |
| Ticket Analytics | Tickets by department, closed tickets by agent, and a per-agent performance table across today, yesterday, this and last week, month and year, and all time. | view_report_ticket_analytics |
| Ticket Review | Tickets opened against tickets closed, by month for a chosen year or by weekday for this week, with the previous period for comparison. | view_report_ticket_review |
Filters #
| Report | Filter |
|---|---|
| New Customers | Year. Compares against the year before. |
| Income per Gateway | Last 3, 6 or 12 months. Defaults to 6. |
| Income Growth | A single year, the last three years, or all time. |
| Income by Currency | Rolling (Last 3/6/12 Months), Calendar (This Month, Last Month, This Quarter, Last Quarter, This Year, Last Year), a specific year, or All Time. Defaults to Last 6 Months. |
| Ticket Analytics | Today, last 7 days, last 30 days, this month, this year or all time. Defaults to 7 days. The filter applies to the charts; the per-agent table always shows all its own columns. |
| Ticket Review | Year, plus a year/week view. Defaults to this year. |
Income by Currency #
New in 1.0.1.1, and the report to reach for once you sell in more than one currency. It answers two questions the other income reports cannot: how much was actually invoiced in each currency, and what each currency is worth as a share of the whole.
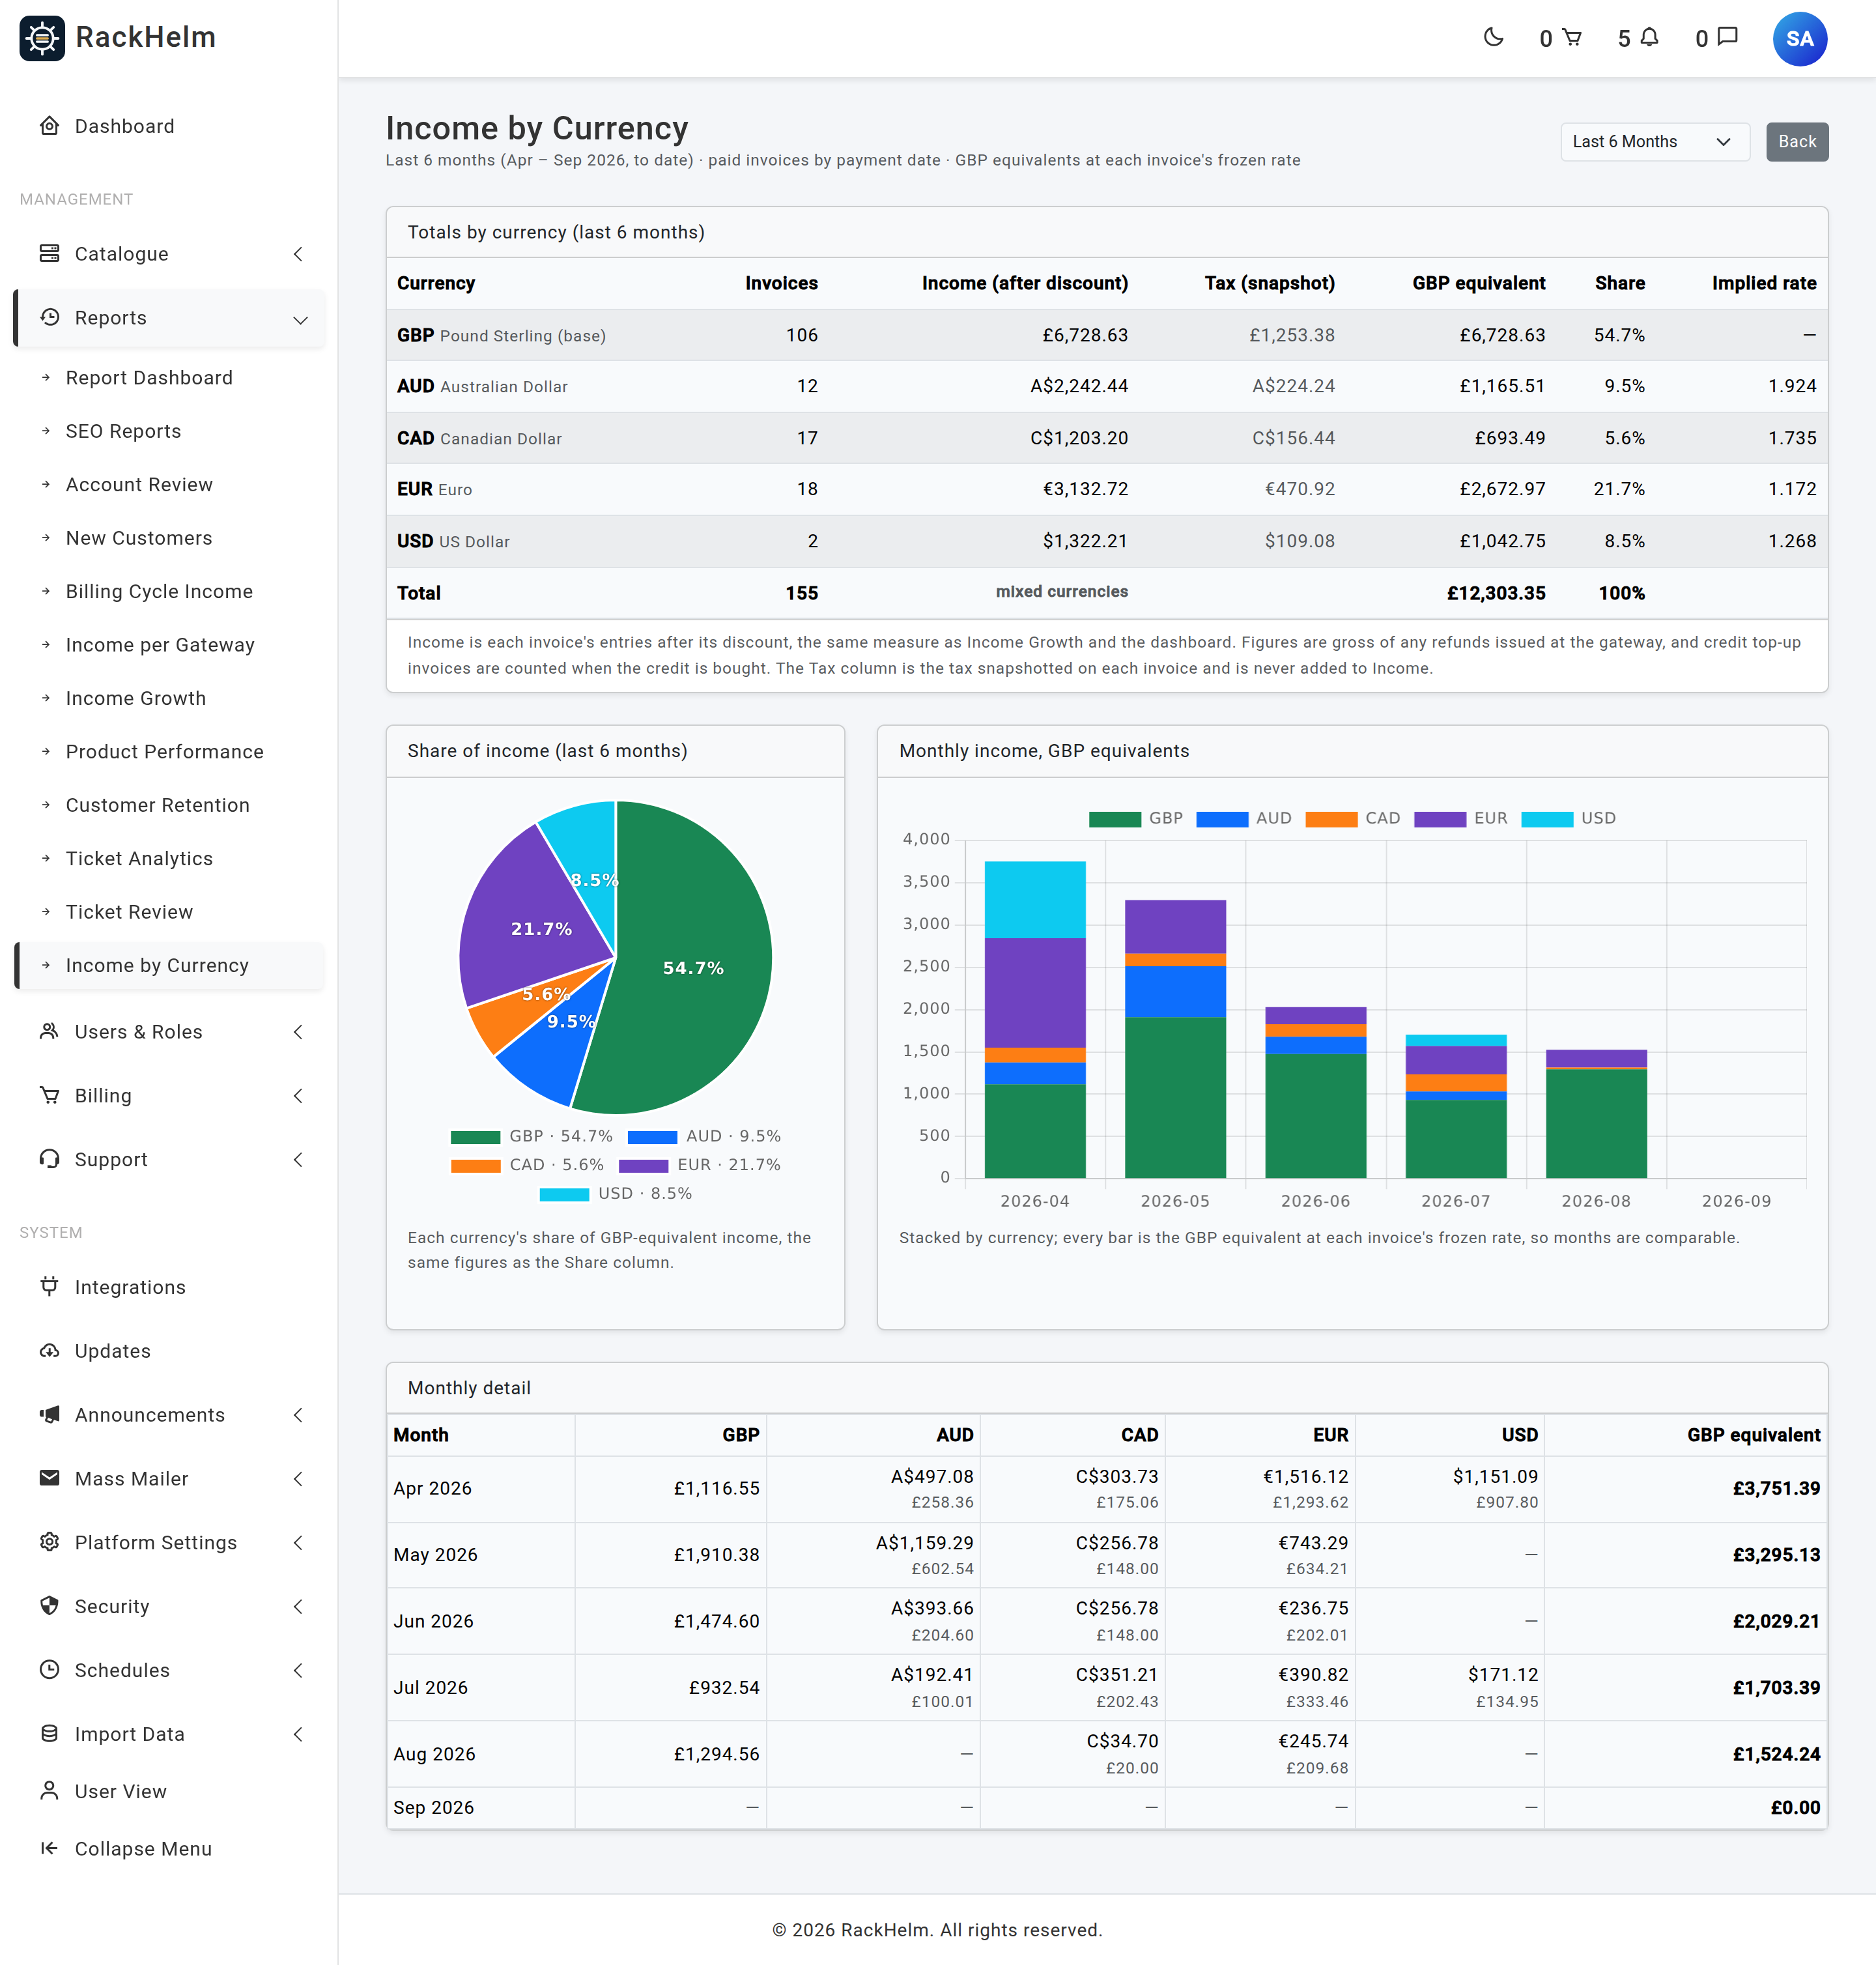
The subtitle under the heading states exactly what you are looking at, for example “This year (Jan – Sep 2026, to date) · paid invoices by payment date · GBP equivalents at each invoice’s frozen rate”. A period that has not finished is marked to date, and This Year stops at the current month rather than padding out to December.
Totals by currency carries one row per currency that has paid income in the period:
| Column | Meaning |
|---|---|
| Currency | The code, its name, and (base) against the store’s base currency. |
| Invoices | How many paid invoices were issued in that currency. |
| Income (after discount) | The amount in that currency’s own units — entries minus the invoice discount. |
| Tax (snapshot) | Only shown when some invoice carries tax. It is the tax frozen on each invoice and is never added to Income. |
| Base equivalent | The same money converted at the rate frozen on each invoice. Headed with your base code, for example “GBP equivalent”. |
| Share | That currency’s percentage of the period’s base-equivalent income. The pie chart plots this column. |
| Implied rate | Native divided by base equivalent, as an effective rate for the period. Shown as — for the base currency and where the two are the same. |
Two badges flag data you should not trust at face value. A legacy code badge means there is no currency row for that code any more — usually an old import — so the amount is printed as a plain number plus the code rather than with a symbol. An N unrated badge in the Implied rate column means that many invoices were frozen without an exchange rate and are being converted 1:1, which flatters whichever currency they are in.
The period selector writes to a query key still named months, so links saved before the calendar periods existed keep working — ?months=6 and ?months=this_quarter are both valid. An unrecognised value silently falls back to Last 6 Months rather than erroring.
The dashboard widget for this report is a different view: a doughnut of the last six months only, grouped by currency with no month axis, captioned “Last 6 months · GBP equivalents”. The period selector does not affect it.
Note: Income by Currency deliberately uses the same measure as Income Growth, so for any period the two totals agree. If they do not, one of them has been filtered differently — check the period first.
How revenue is measured #
Every money figure derived from invoices is built the same way, so those reports agree with one another and with the dashboard: an invoice is valued as the sum of its line items — unit price × quantity, plus any setup fee — minus the invoice discount, and never below zero. Only invoices marked paid count, dated by when they were paid. Deleted invoices are excluded.
Since multi-currency pricing arrived, that value is then divided by the exchange rate frozen on the invoice at issue time, giving a base-currency equivalent. Freezing the rate is what makes last year’s figures stable: refreshing today’s rates cannot restate a report you ran last month.
Warning: Reports that measure order items rather than invoices do not convert currencies at all. Billing Cycle Income and Product Performance sum
unit_priceacross active items whatever currency they were sold in, and Product Performance then labels the chart axis with the base currency’s symbol. In a single-currency store they are correct; in a mixed one they add unlike amounts together. Customer Retention’s lifetime value and every Income report are invoice-based and are converted properly.
Warning: Credit top-ups are counted twice by every income report. Buying credit raises a paid invoice, which counts as income; the invoices that credit later pays are marked paid too, and count again. The Income by Currency footer says so in as many words — “credit top-up invoices are counted when the credit is bought” — but the same is true of Income Growth, Income per Gateway and the dashboard tiles. If your customers use account credit, these reports overstate income.
Warning: Refunds are not deducted anywhere. Figures are gross of anything refunded at the gateway. Use your accounting system, not these reports, for anything you file.
The Tax (Est) column on Income Growth used to be a flat 20% of the total, calculated for guidance only. Once the tax and multi-currency schema is in place it shows the real tax snapshotted on each invoice, converted to the base currency; the flat estimate survives only as a fallback on an install that predates that schema. The column heading still reads “Tax (Est)” either way, so check which install you are on before quoting it.
Income per Gateway #
The report is named Income per Gateway in the sidebar and on the index card, but its own page is headed Income by Gateway. They are the same report.
It groups paid invoices into four rows. Before 1.0.1.1 it treated any order that had anything at all in its Stripe reference field as Stripe income, which swept in bank transfers, free checkouts and imported orders. It now inspects the value:
| Row | What lands in it |
|---|---|
| Stripe | The invoice’s own settled Stripe intent, or failing that the order’s, recognised by its pi_ prefix. A first term paid by bank transfer that later renews on a card is Stripe income for the renewal. |
| Bank Transfer | Orders marked as awaiting a bank transfer at checkout. |
| Authorize.net | Orders still carrying the held-payment marker. |
| Manual/Other | Everything else: free checkouts, imported orders, account credit, manual payments — and, today, PayPal, Square and settled Authorize.net payments. |
Note: PayPal and Square are not broken out. Both record their own capture or payment id against the order, which is neither a Stripe intent nor a recognised marker, so their income is reported as Manual/Other. Authorize.net is the same once a held payment settles: settling replaces the held marker with the processor’s transaction id, so the Authorize.net row only ever holds payments that are still under review.
Warning: This report joins invoices to orders, so an invoice with no single order behind it — a merged invoice covering several renewals — is dropped from it entirely. Income Growth and Income by Currency include those invoices. That is the usual reason Income per Gateway totals less than the other two for the same months.
Its figures are also unrounded: converted months can print to several decimal places on this report’s chart and table, where Income Growth now rounds to the base currency.
Pinning a report to the dashboard #
- Open the dashboard and choose Configure on the Quick Reports panel.
- Tick up to five reports and drag them into the order you want.
- Save. The layout is stored against your own account, so other staff are unaffected.
Only reports you have permission for are offered, and the five-widget limit is enforced on the server as well as in the dialog. Until you save a preference the first five reports you can see are used — on a stock install, Account Review through Income Growth. Income by Currency sorts last, so you have to pin it deliberately.
Troubleshooting #
| Symptom | Cause and fix |
|---|---|
| “Unauthorized access to this report.” | You hold view_reports but not that report’s own view_report_* permission. Add it to the role. Permissions are cached per user for 24 hours, so a fresh grant may not take effect immediately. |
| A report is missing from the sidebar | Its row is not active. The sidebar lists active reports only — but it does not filter by permission, so a missing entry is never a permissions problem. |
| A dashboard widget shows a red backend-error box | The report’s query failed. Open the report’s own page for the full error, and check the application log. |
| Revenue figures look lower than expected | Only invoices marked paid are counted, and they are dated by their paid date. Invoices sitting pending contribute nothing, and deleted invoices are excluded. |
| Income per Gateway totals less than Income Growth | Merged invoices have no single order and are dropped by Income per Gateway. See the warning above. |
| PayPal or Square income shows as Manual/Other | Expected. Only Stripe, bank transfer and held Authorize.net payments are identified separately. |
| Income by Currency shows a currency with no symbol | The code has a “legacy code” badge: there is no currency row for it, so it is printed as a number plus the code rather than guessed at with the base symbol. |
| One currency’s implied rate looks like 1.0000 | Those invoices were frozen without an exchange rate and converted 1:1. The “N unrated” badge counts them. |
| New-customer counts look low | Guest placeholder accounts from the contact form and inbound support mail are excluded by design. |
| You need a report that does not exist | Reports cannot be added from the admin area. Raise it with your RackHelm supplier. |


