The admin dashboard is an operator’s cockpit: five headline numbers, a configurable strip of quick reports, a “needs attention” queue that lists only work that actually needs a human, and panels covering provisioning health, background jobs and the scheduler. Every panel is gated by permission, so what a staff member sees depends on their role. This article is for the staff who run the platform day to day, and for whoever decides what their roles may see.
Before you start #
Note: The dashboard route checks a
staff_panelability, which is not one of RackHelm’s seeded permission keys. Unless your install has added it, only a Super Admin can open/admin/dashboarditself; other staff should be linked directly to the screens their role covers.
Individual panels are gated by four widget permissions and, for the quick reports, by the per-report permissions:
| Permission | Unlocks |
|---|---|
view_widget_income |
MRR/ARR/churn, Revenue · 7d, Recent orders, Top packages |
view_widget_tickets |
Awaiting staff reply, and the matching action-centre row |
view_widget_invoices |
Overdue A/R, the overdue and upcoming-renewal action rows |
view_widget_provisioning |
Provisioning health, in-flight and SSL rows in Operations, and the failed/stuck/SSL action rows |
view_schedules |
The Scheduler row in Operations and the System schedule status table |
manage_roles |
The Queue workers row and the failed-jobs action row |
Because each widget carries its own permission, two staff members opening the same URL can legitimately see two different dashboards. The New customers · 7d tile is the one exception: it is not gated, so anyone who can open the dashboard sees it.
By default Billing Manager holds the income, invoices and provisioning widgets; Support Agent holds the tickets widget. See Roles & Permissions.
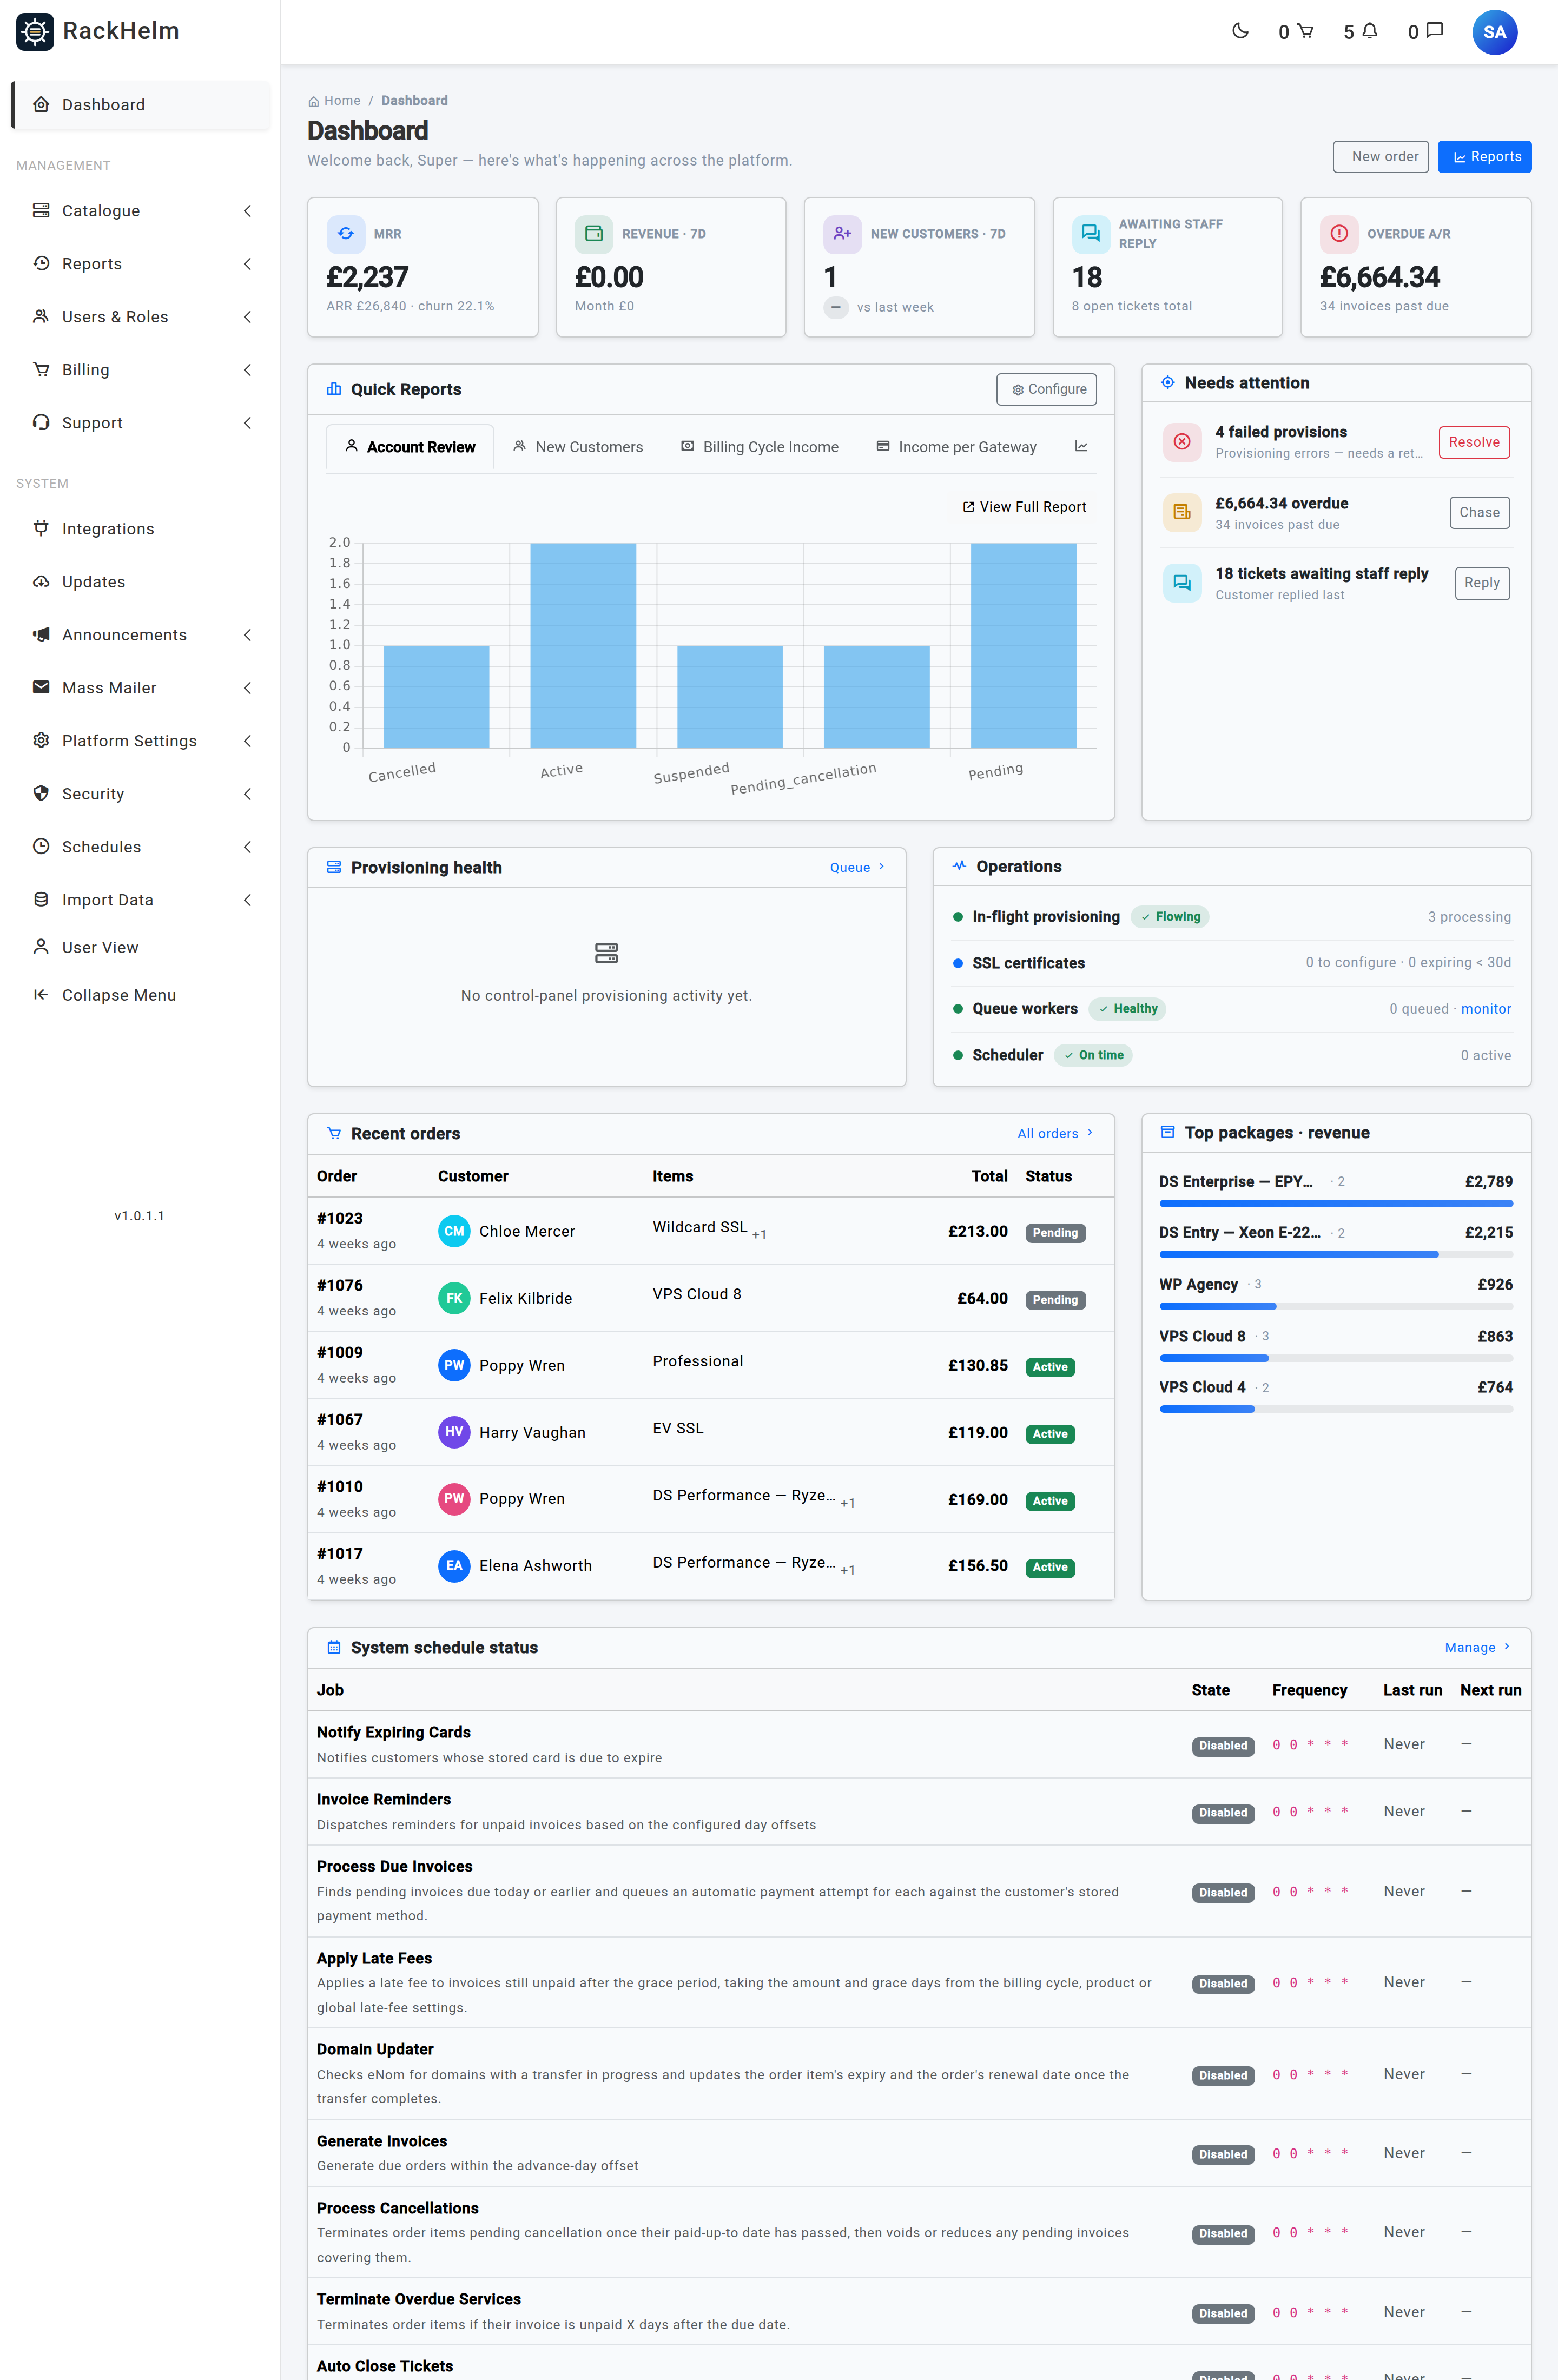
The KPI strip #
| Tile | How it is calculated |
|---|---|
| MRR | Monthly recurring revenue: each active order item’s unit price divided by the number of months in its billing cycle, summed. Setup fees are excluded because they are one-off, and quantity is not applied — an item bought three times contributes its unit price once. The subtitle shows ARR (MRR × 12) and the churn rate. |
| Revenue · 7d | Invoices paid since the start of this week, valued as line items (unit price × quantity, plus setup fee) minus the invoice discount, never below zero. The delta compares the same measure for last week; the subtitle shows the month to date. |
| New customers · 7d | Registered accounts created since the start of this week, compared with last week. Guest placeholder records — created by the contact form and inbound support mail — are excluded; a guest who later registers starts counting. |
| Awaiting staff reply | Tickets that are neither closed nor awaiting guest verification, whose most recent message was written by the customer. This is the real work queue: ticket status alone is unreliable, because a customer replying through the portal does not change it. The subtitle shows total open tickets. |
| Overdue A/R | The value of pending and unpaid invoices whose due date has passed, with a count. Clicking through opens the invoice list filtered to overdue. |
Churn is measured across order items: cancelled plus terminated, as a percentage of cancelled, terminated and active combined. Nothing on this page is cached — every figure is queried afresh on each load.
Which currency the figures are in #
Since multi-currency pricing arrived, a store can hold invoices in several currencies at once, so the dashboard has to say which unit its numbers are in. Everything except the Recent orders table is shown in the store’s base currency, with that currency’s symbol and decimal places.
- Invoice-derived figures — Revenue · 7d, the month-to-date subtitle, Overdue A/R and the renewals row — are converted at the exchange rate frozen on each invoice when it was issued. A past figure therefore does not move when today’s rates refresh.
- MRR and ARR are converted at the rate currently held against each order’s currency, because an order carries no frozen rate and MRR is a forward-looking figure. Restating today’s rates restates MRR.
- Recent orders formats each order’s total in that order’s own currency, not the base currency. It is the only place on the page where two rows can be in different units.
Warning: Top packages · revenue is not converted. It sums unit price × quantity across active order items whatever currency they were sold in, then prints the base currency’s symbol in front of the result. In a single-currency store it is correct; in a mixed one it adds unlike amounts together and mislabels them. Treat it as a ranking, not as a money figure.
Quick Reports #
The left-hand panel embeds up to five report widgets. Configure opens a dialog where you choose which reports appear and in what order; the choice is saved per user, so each staff member gets their own layout. Until you save a preference, the first five reports you have permission to see are shown — on a stock install that is Account Review, New Customers, Billing Cycle Income, Income per Gateway and Income Growth.
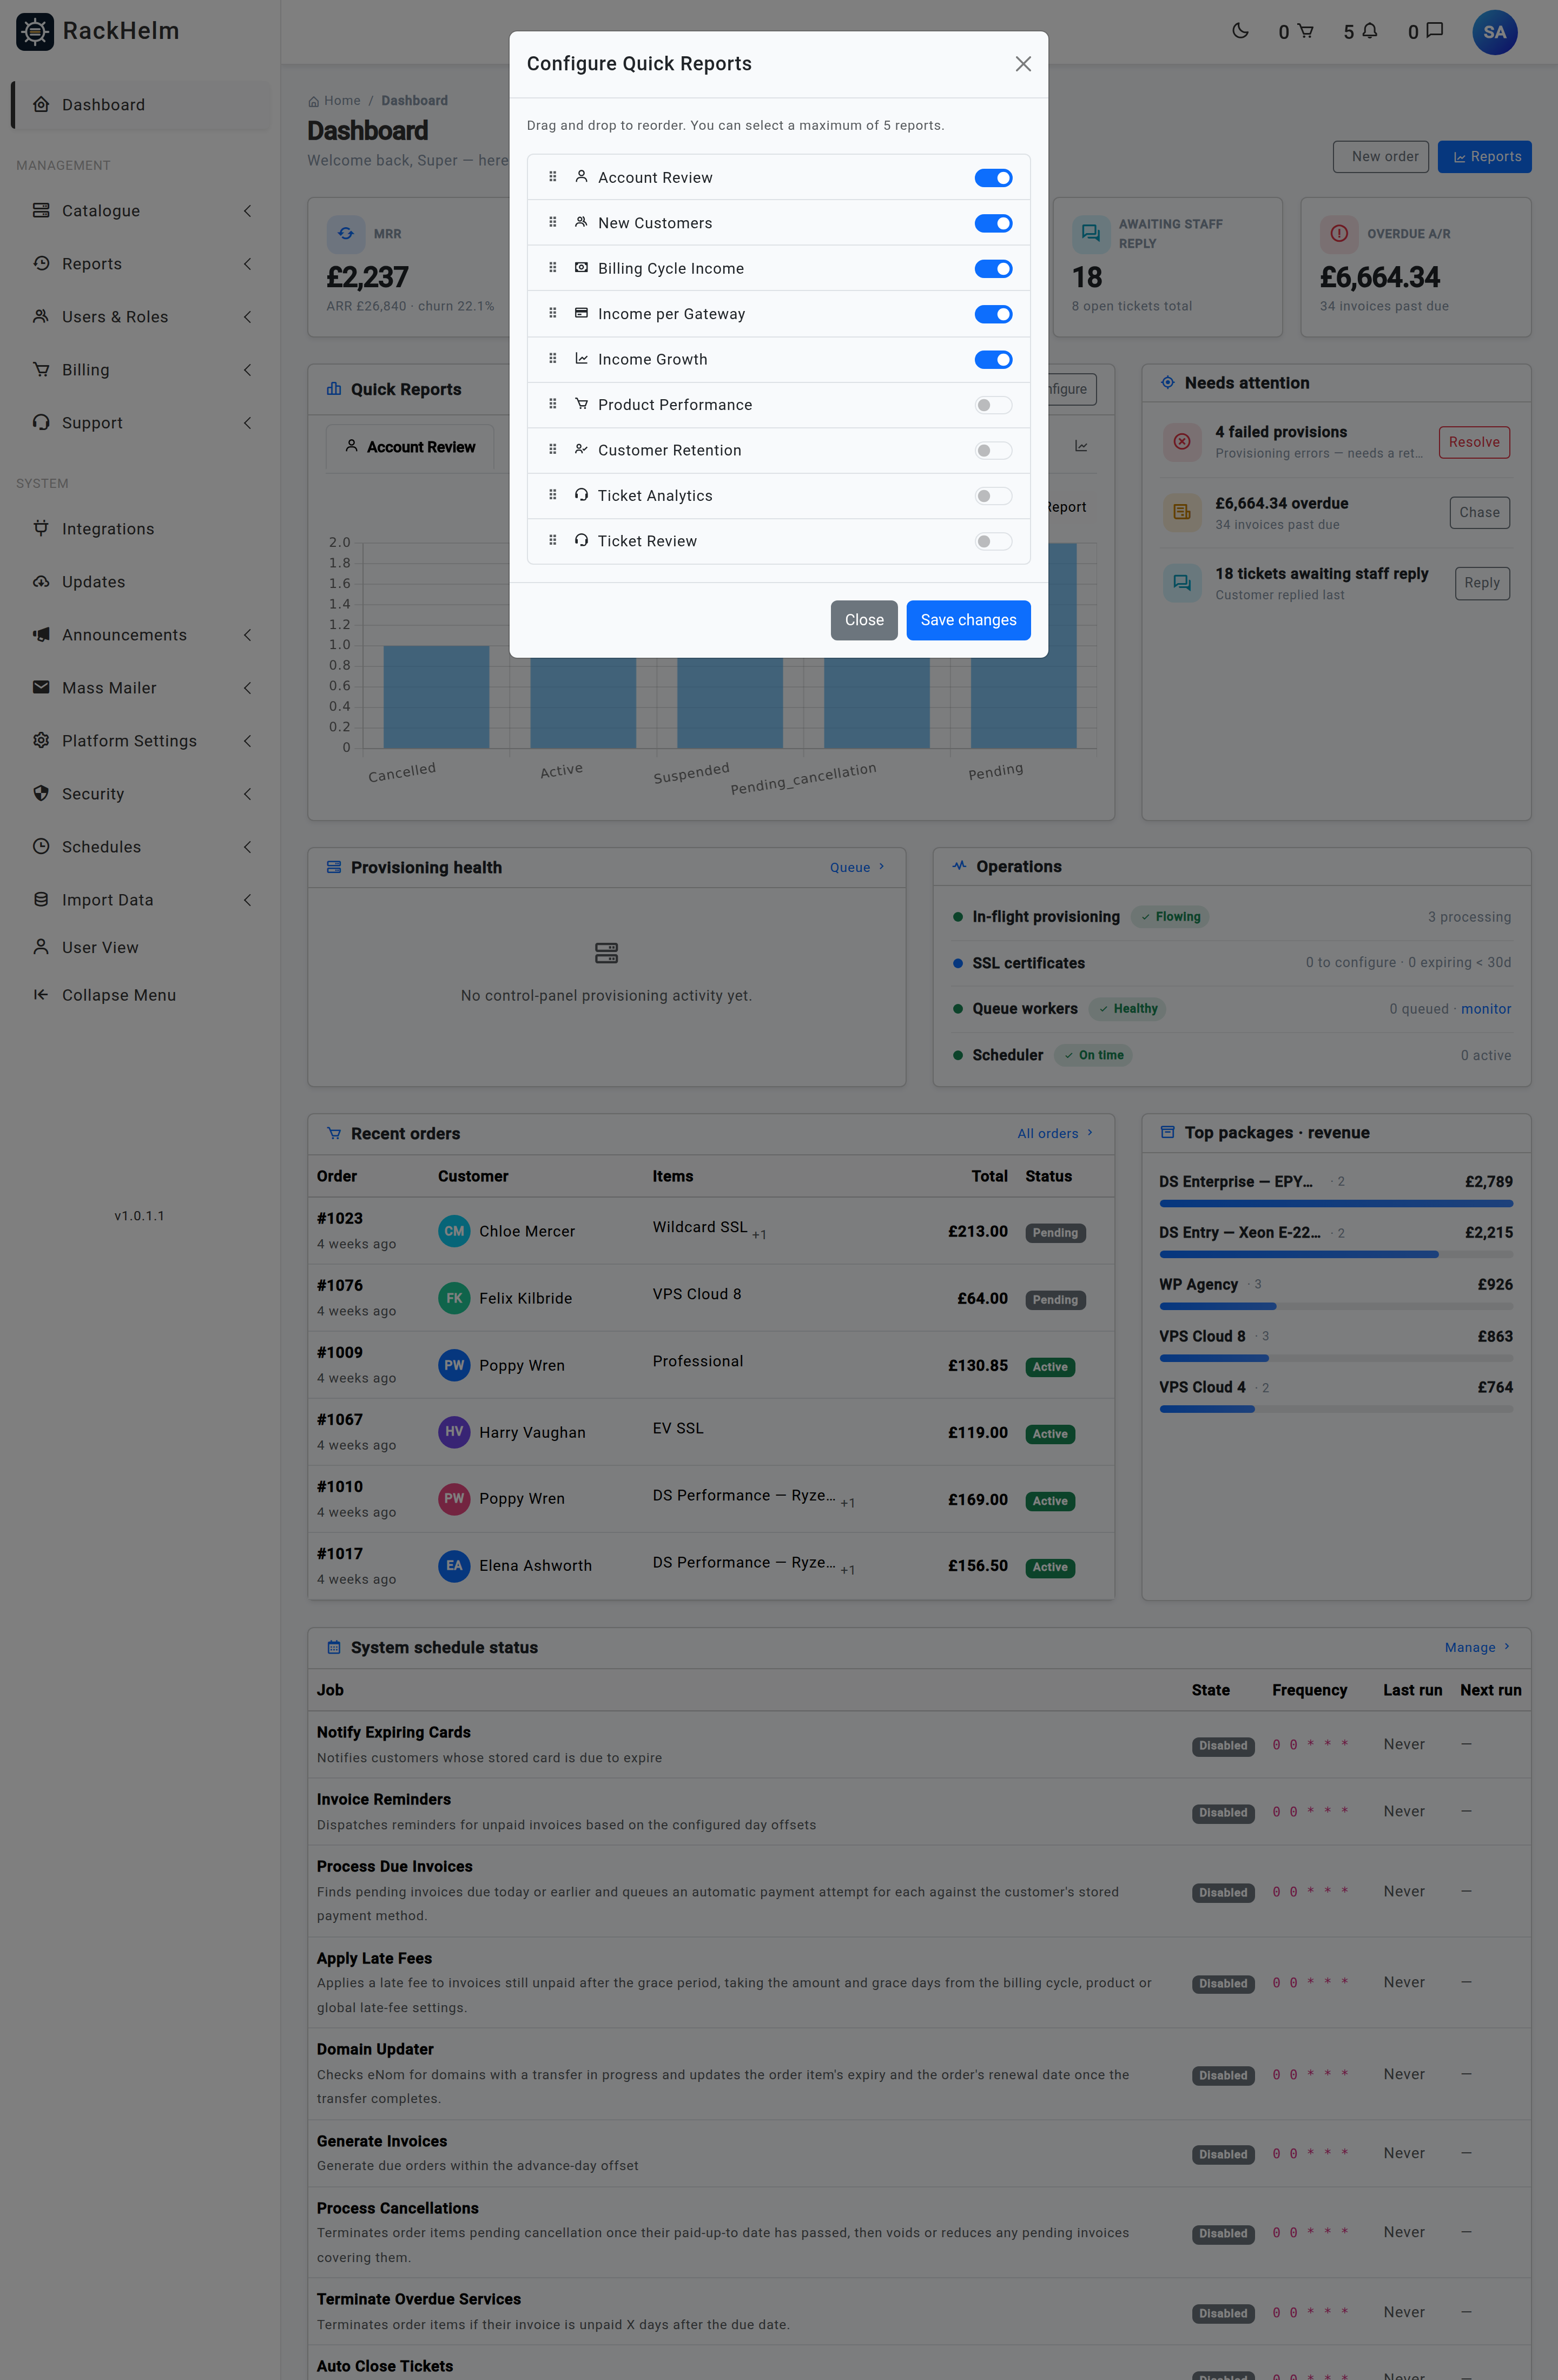
Only reports you hold the matching view_report_* permission for are offered. See Reports.
Each tab is loaded lazily: switching to it fetches /admin/reports/{slug}?widget=true in the background, showing “Loading graph…” while it waits. The first tab loads once the chart libraries have finished downloading, not at the moment the page appears — which is why it can lag a second behind the rest of the dashboard.
Note: The five-widget limit is enforced on the server as well as in the dialog. The browser refuses the sixth switch with “You can only select a maximum of 5 reports to display.”; if a request gets past that, the server rejects it with “You can only select up to 5 reports to display.”
Needs attention #
The action centre lists only queues that are non-empty, in order of blast radius, each with a button that takes you to the screen where you can act. When everything is clear it says so.
| Row | What it means |
|---|---|
| Failed provisions | Order items whose provisioning errored. Needs a retry. |
| Stuck in-flight | Items claimed by a worker more than 15 minutes ago that never finished — usually a dead worker or a hung integration. |
| Overdue | The overdue A/R total, with a link to chase it. |
| Tickets awaiting staff reply | The customer replied last. |
| SSL certs to configure | Certificates bought but not yet configured by the customer. |
| Renewals due in 7 days | Count and expected value, with the 30-day figure alongside. |
| Failed jobs | Failed background jobs. Provisioning may be stalling. |
Provisioning health #
One bar per control-panel integration in use, showing active and failed counts and a health percentage — the share of that integration’s order items that are not in a failed state. Green is 98% or better, amber 90% or better, red below that. The panel is empty until there has been some control-panel provisioning activity.
Operations #
- In-flight provisioning — how many items are queued or processing, and whether any have been stuck for more than 15 minutes.
- SSL certificates — how many await configuration, and how many issued certificates expire within 30 days.
- Queue workers — healthy, down, or a failed-job count, with the current backlog and a link to the queue monitor. Shown only to holders of
manage_roles, matching the queue monitor’s own boundary. - Scheduler — how many schedules are enabled, whether any are overdue, and how long ago the most recent one ran.
Recent orders and Top packages #
Recent orders lists the six most recent orders with their customer and items. Top packages · revenue ranks your five highest-revenue products across active order items, showing units sold and a relative bar. Both require view_widget_income.
Orders raised by Create Invoice, and orders brought in by an importer, carry no line items at all — their lines and their value exist only on the invoice. Those rows used to show a dash and a zero total. They now fall back to the order’s newest invoice, showing that invoice’s first line description and its value with a small invoiced label under the amount, so a manual charge no longer reads as nothing.
System schedule status #
The table at the bottom lists every schedule with its state, cron expression, last run and next run, each name linking to its editor. It is the fastest health check for automation — see System Schedules.
Troubleshooting #
| Symptom | Cause and fix |
|---|---|
| A staff member sees a mostly empty dashboard | Expected. Panels are gated by the widget permissions above. Grant the ones their role needs. Permission checks are cached per user for 24 hours, so a change made today may not show until tomorrow unless the cache is cleared. |
| MRR looks far lower than your actual billing | MRR counts active order items only, excludes setup fees and ignores quantity. Items still pending provisioning, suspended or cancelled do not contribute. |
| MRR moved overnight and nothing was sold | MRR converts each order’s currency at the rate held now, and rates refresh hourly from the European Central Bank. Only a single-currency store has a steady MRR. |
| Revenue · 7d disagrees with your gateway’s figures | The tile values invoices from their line items minus the discount, converted at each invoice’s frozen rate, and counts them from the date they were marked paid. Refunds are not subtracted, and credit top-ups are counted when the credit is bought. |
| Top packages totals look impossible | That panel adds order-item prices without converting currencies, then labels them with the base symbol. See the warning above. |
| A recent order shows a total but no package name | It has no line items — it was raised by Create Invoice or imported. The row is being read from its invoice; the small invoiced label under the amount marks it. |
| The Queue workers row is missing | Either you do not hold manage_roles, or the queue system could not be reached — the panel is hidden rather than showing a broken figure. |
| Provisioning health is empty | No order items are attached to an active control-panel integration yet. |
| A quick report tile shows “A backend error occurred” | That report’s query failed. The full error is in the application log; open the report on its own page to see it in full. |
| A quick report tile shows “Failed to load widget data.” | The background fetch itself failed — usually a 403 because your role lost that report’s view_report_* permission, or a network error. The browser console holds the response. |
| The Income Growth chart shows numbers like 2000.000000 | Fixed in 1.0.1.1. The chart library padded every label to the largest number of decimals in the data, and one currency-converted month supplied six. Figures are now rounded and shown in the base currency, for example £2,000.00. |
| The scheduler shows jobs as overdue | The per-minute cron entry is not running. See System Schedules. |
| New customer counts look low | Guest placeholder accounts are deliberately excluded, so contact-form and inbound-email records do not inflate the figure. |


