My Sites is where you manage web hosting bought from your provider — the PHP environment, the applications installed on the site, security findings and backups, plus links out to domains, email, databases, FTP and the SEO report. This article covers the site list and the dashboard itself; each toolbar destination has its own article. It is written for the customer signed in to the portal.
Before you start #
The My Sites sidebar entry appears once the account owner has a hosting package that is active or pending cancellation and whose product is bound to a control panel the portal knows: Enhance, cPanel/WHM, Plesk, DirectAdmin, CyberPanel or ISPmanager.
What you can actually do from these pages depends on which of those panels your plan runs on. The portal talks to each one through its own adapter, and a tab is only offered when that adapter can serve it — a link to a page the adapter cannot answer would produce an error rather than a screen, so it is not rendered at all.
| Panel | Managed from the portal | Not offered |
|---|---|---|
| Enhance | FTP, Domains & DNS, Email, Databases, PHP version, Applications, Backups | — |
| cPanel/WHM | FTP, Domains & DNS, Email, Databases, PHP version, Applications, Backups | Restoring a backup, WordPress updates, Force HTTPS, changing the primary domain |
| Plesk | FTP, Domains & DNS, Email, Databases, PHP version, Applications (WP Toolkit) | Backups, SSL issue/upload, Force HTTPS, PHP-FPM restart, changing the primary domain |
| DirectAdmin, CyberPanel, ISPmanager | Nothing | Everything — these panels have provisioning drivers but no customer-facing site API yet |
Warning: A package on DirectAdmin, CyberPanel or ISPmanager still appears in the site list and still opens, but there is nothing to manage. The dashboard shows “The hosting panel is not reachable right now. Please try again shortly.” and the toolbar carries only Dashboard. Nothing is broken with the site — use your provider’s own panel.
Warning: Sub-accounts can see the owner’s sites in the list but cannot open them. The list is built from the account owner’s packages, while each site page is looked up against the signed-in user’s own orders, so a sub-account following a link from the list gets a “not found” page. Sign in as the account owner to manage a site.
The site list #
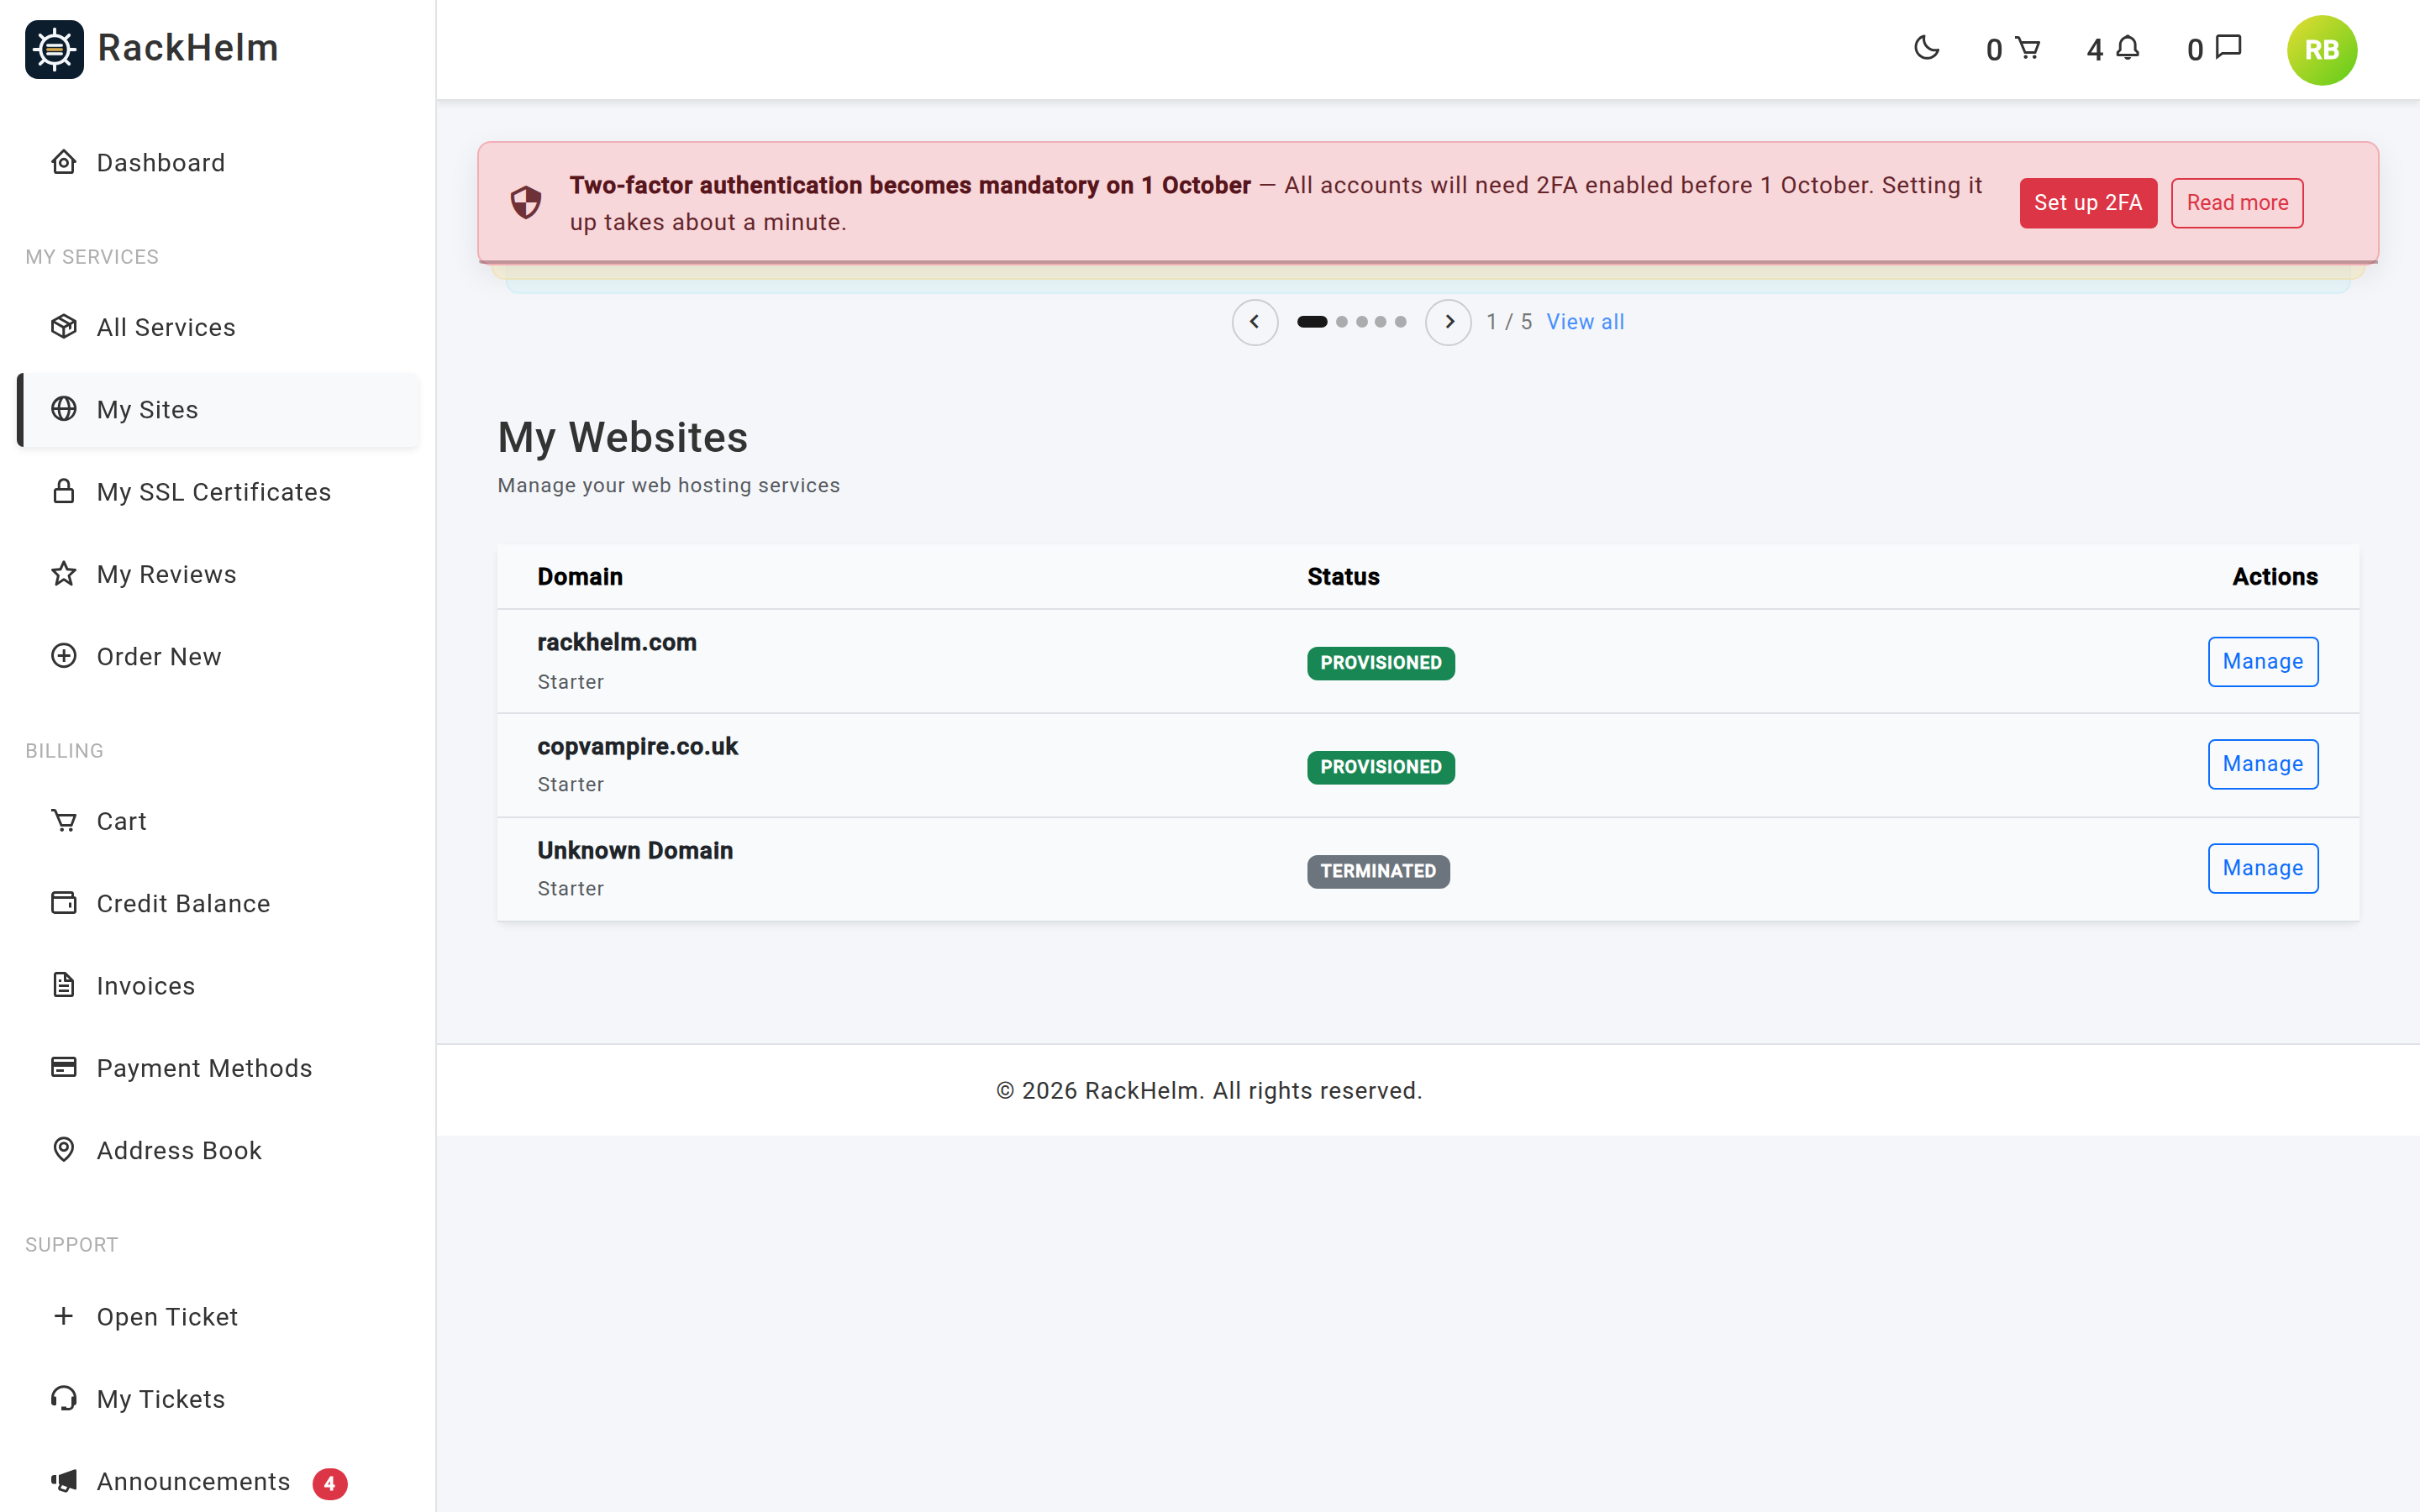
/sites lists fifteen sites per page with three columns: Domain (with the plan name underneath), Status and Actions. Selecting the domain or Manage opens the dashboard.
The status badge prints the provisioning status the portal holds, not a status read from the panel. Only some values are colour-coded: provisioned is green, pending is blue, failed is red. The other values a package can hold — queued, processing, in_progress, awaiting_configuration, complete — render grey. Grey means “in between”, not “wrong”.
Note: The list can be filtered by adding
?q=to the address, for example/sites?q=example.com. There is no search box on the page in this release. The filter matches the package id, the panel’s own site id, and the domain that was ordered. A site whose primary domain was later changed inside a cPanel or Plesk panel is still only findable under the name it was ordered with.
The site toolbar #
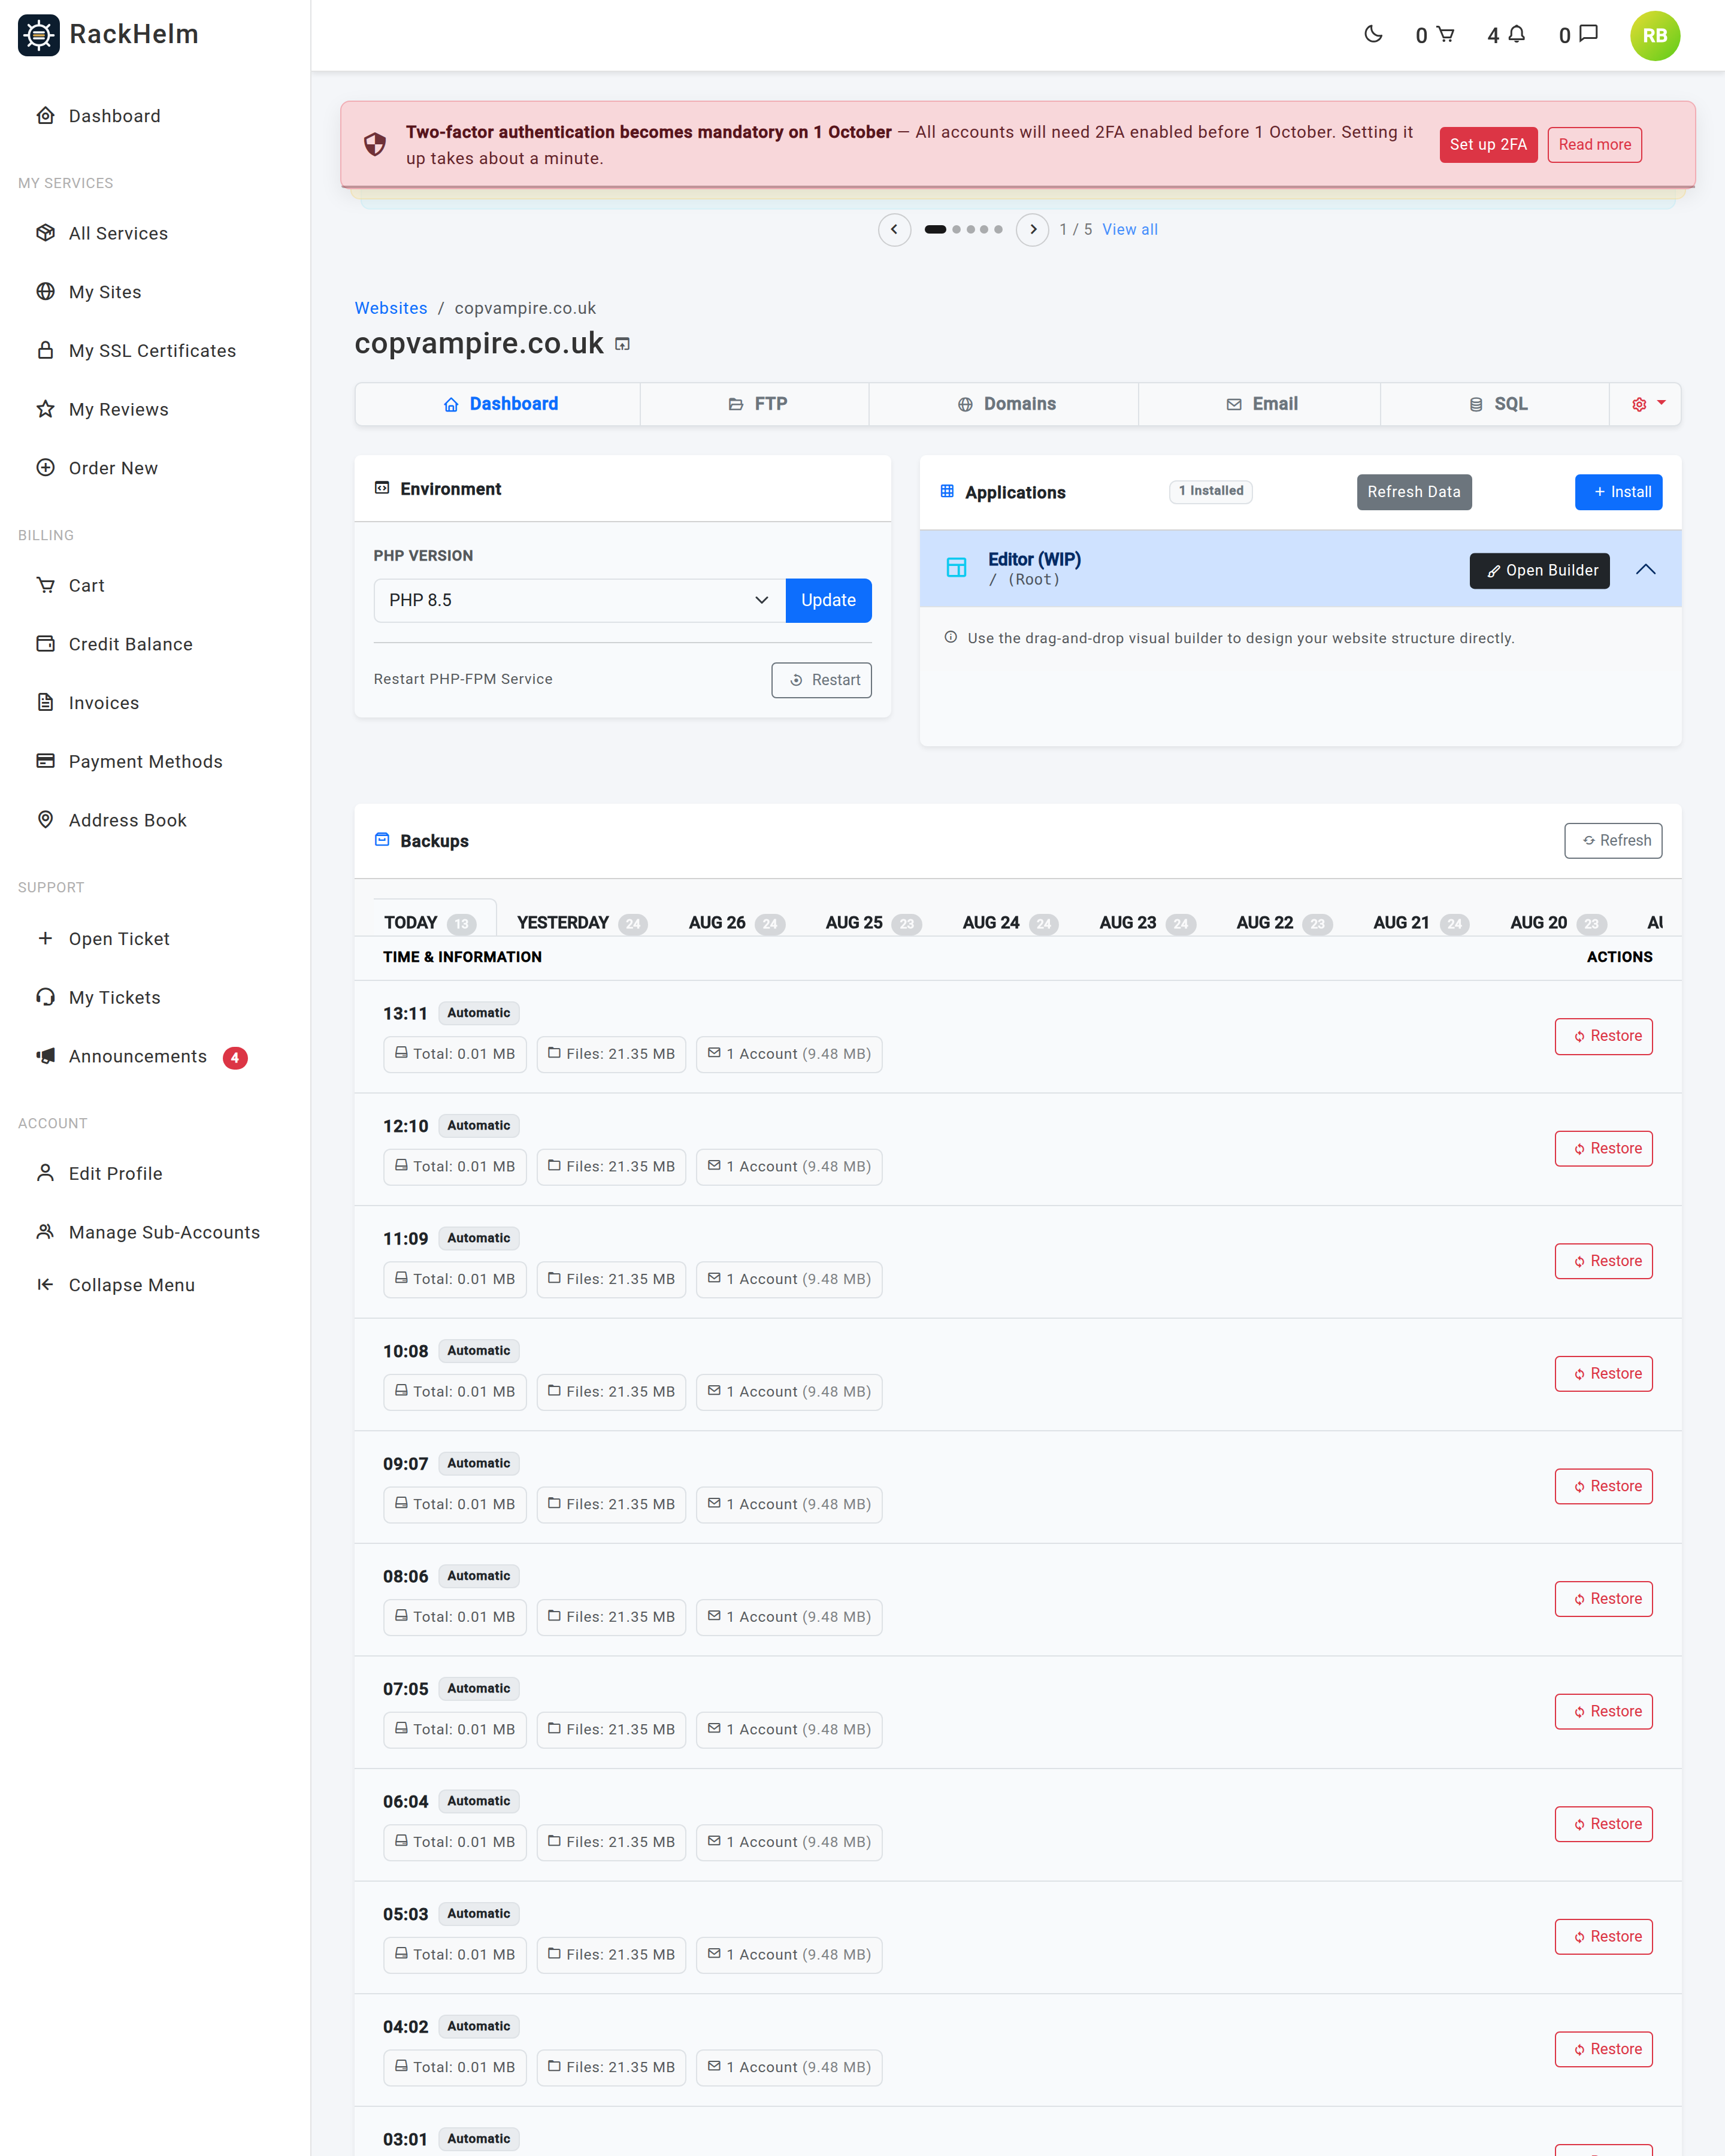
Every site page carries the same toolbar under the domain name. It is how you move between the site’s tools. Entries your panel cannot serve are not shown.
| Button | Goes to |
|---|---|
| Dashboard | This page — environment, applications, security and backups. Always shown. |
| FTP | FTP accounts. |
| Domains | Domains, DNS records and site SSL. |
| Mailboxes and webmail. | |
| SQL | Databases, database users and phpMyAdmin. |
| AI SEO | The SEO report. Only shown when your provider has the module switched on and holds a licence key, and either you hold the AI SEO add-on or free scans are enabled. |
| Cog button | Cancel Service. You are asked to confirm, then to re-enter your account password. |
The small window icon next to the domain name opens your website in a new tab.
Two further pages are not on the toolbar. The log viewer is at /sites/{id}/logs (see Logs and threat scanning) and the drag-and-drop site builder is reached from the Applications card (see The website builder).
The dashboard #

Environment #
Sets the PHP Version for the site, and offers Restart PHP-FPM Service. See PHP version and settings.
On cPanel and Plesk the version list is read from the server, so it offers exactly the versions that node has installed. Enhance does not expose that list, so an Enhance site falls back to the built-in choices — PHP 8.3, 8.4 and 8.5 — plus whatever the site is running now, shown as, for example, PHP 8.1 (current).
Where the panel has no PHP adapter at all the version is shown read-only, with “The PHP version for this site is changed in <panel> directly.” Areas the panel keeps to itself are named the same way, so a missing card is explained rather than simply absent — on Plesk the card reads “Backups is managed in Plesk directly.”
Warning: On Plesk the Restart button is shown but always fails, with “FPM restart failed: Restarting PHP-FPM is a server-wide action on Plesk, so it is not offered per site. Switching the PHP version above reloads the handler for this site; contact support if a service restart is needed.” Switching the PHP version is the supported way to reload the handler.
Applications #
Lists what is installed on the site, with a count badge, a Refresh Data button and an Install button. Each application expands to show its version and, for WordPress, its plugin and theme counts, along with buttons to sign in, update the core and uninstall. Full detail is in WordPress tools.
Refresh Data clears the cached list and returns with “Application data successfully refreshed from the server.”
When nothing is installed, an Editor (WIP) entry appears at the top of the list with an Open Builder button. It disappears as soon as an application is installed.
Installing an application #
- Select Install.
- Choose the Application. On Enhance the list comes from your provider’s panel, filtered to the newest version of each application; the current WordPress release is pre-selected and marked [Recommended]. On cPanel and Plesk the only application on offer is WordPress.
- Set the Installation Path — a folder below the site root, for example
blog. Leave it empty to install at the root. - Fill in Admin Username, Admin Password and Admin Email. All three are required and the email must be a valid address.
- Select Install Application.
Installation runs in the background — you are returned to the dashboard with “WordPress is now installing in the background. It will be available in a minute or two.” Use Refresh Data once it has had time to finish.
Warning: On cPanel hosting WordPress can only be installed at the site root. If you fill in Installation Path, the install is refused by the panel adapter with “On cPanel hosting WordPress is installed at the site root. Leave the installation path blank and try again.” — but because the install runs on a background queue, you still see the “now installing” message and the refusal is only written to the server log. Nothing appears, and nothing tells you why. Leave the path blank on cPanel. Sub-folder installs do work on Enhance and on Plesk.
Note: If the panel cannot be reached when the modal opens, the picker says “No applications available right now” and the Install Application button is hidden, instead of showing an empty dropdown. A failed catalogue fetch is deliberately not cached, so trying again in a minute usually works.
Security Scan Report #
Shown only when your provider has entered a cPGuard API Key against the panel your site is on. That field exists on every panel type the portal supports, so the report is not limited to Enhance. cPGuard is reached on port 9098 of the panel host. It reports vulnerable WordPress plugins and themes with a CVSS score. See Logs and threat scanning.
Note: The report’s Update and auto-update actions are not built yet. Their endpoints exist but answer “Component updates are not available from the portal yet. Please update the component from within WordPress.”
Backups #
Lists recent backups grouped by date, with a Restore button on each, and a Refresh button on the card header. The card is shown on Enhance and cPanel only. See Backups and restores.
Why data sometimes looks stale #
Talking to the control panel on every page load would make the dashboard slow, so several panels are cached:
| Data | Cached for | How to force a refresh |
|---|---|---|
| PHP version and site details | Not cached — read live on every load | — |
| The installable-application list | 1 hour (a failed fetch is not cached) | — |
| Installed applications | 10 minutes | Refresh Data on the Applications card |
| Metrics, SSL and recent backups | 5 minutes | — |
| The backups list | 2 hours | Refresh on the Backups card |
| Security scan findings | 5 minutes, keyed on the domain | Reload the dashboard |
The PHP version used to share the hour-long cache, which meant a switch made here or straight in the panel kept showing the old version for up to an hour. It is now read live every time.
Troubleshooting #
| Symptom | Cause / fix |
|---|---|
| “This site is not connected to its hosting panel yet. Please contact support.” | The portal holds no panel address or no API token for this package — or, on Enhance, no organisation id. This is a provider-side configuration problem; open a ticket. |
| “The hosting panel is not reachable right now. Please try again shortly.” | The panel’s address was rejected or would not resolve, or the package is on a panel with no customer site API (DirectAdmin, CyberPanel, ISPmanager). Reload; if it persists, open a ticket. |
| “Applications cannot be managed right now. The site is pending provisioning or missing its external ID.” | The site has not finished being created on the panel. Check the status badge on /sites and wait. |
| “Failed to load applications.” in the Applications card. | The background request to the panel failed. Reload the page; if it persists, open a ticket. |
| A newly installed application does not appear. | The list is cached for 10 minutes. Use Refresh Data. |
| Opening a site that is still provisioning. | The dashboard opens anyway. The Applications panel carries the “pending provisioning” message above, and the other tabs will not return data until the panel has created the site. |
| The security scan panel never appears. | Your provider has not entered a cPGuard API Key for the panel this site is on. Nothing is wrong with the site. |
| “That domain is not assigned to this site.” | The security report is fetched by domain name and the portal checks that name against the panel first. If the domain the portal holds no longer matches the panel, open a ticket. |
| A tab you expected is missing from the toolbar. | Your panel’s adapter cannot serve it. Check the capability table at the top of this article. |


